It was not too long ago that the economy was in a spiral, housing crash, stock fears, and the evil 1%. When you look at a enitre nation, the 1% is often very clear, it is the rich money men, the bankers, the hedge fund managers, lighting their cigars with $100 bills…right?!?
Wrong! The real 1% is your local city staff. In almost all cities across the nation, city employees are some of the highest paid employees. Insome cases the average city employee makes an average of double the average private worker. When you look at counties with a greater disparity between the cities cost of living, you will often find more abuse of the affluence through the ‘Compare & pay’ method process used to determine wages.
It goes without saying, that a city may have thousands of employees, most of which make a modest living, meet the traditional American portrait, and that is great! But we must not lose focus that the role of city government is to serve the people.
Currently, Lompoc is in a budgetary crisis, which is unfortunate, but if you look at the amount of employee raises that have been handed out, it is clear why Lompoc cannot afford itself keeping to the pension promises it made.
Furthermore, I believe Lompoc’s #1 enemy, is Bradford Wilkie. As the financial manager, it is his job to identify the risks, help maintain proper wage rates, and keep Lompoc in the black. Today he is one of the top 5 paid employees and has received raises each year since 2011.
| Name | Job title | Regular pay | Overtime pay | Other pay | Total pay | Benefits | Total pay & benefits |
|---|---|---|---|---|---|---|---|
| BRADFORD WILKIE | Management Srv Dir/Fin Dir/City Treasurer Lompoc, 2016 |
$155,079.00 | $0.00 | $0.00 | $155,079.00 | $50,602.00 | $205,681.00 |
| Bradford Wilkie | Management Srv Dir/Fin Dir/City Treasurer Lompoc, 2015 |
$130,811.80 | $0.00 | $2,017.20 | $132,829.00 | $44,063.00 | $176,892.00 |
| Bradford Wilkie | Management Srv Dir/Fin Dir/City Treasurer Lompoc, 2013 |
$109,887.00 | $0.00 | $2,041.00 | $111,928.00 | $51,732.00 | $163,660.00 |
| Bradford Wilkie | Management Srv Dir/Fin Dir/City Treasurer Lompoc, 2014 |
$115,902.00 | $0.00 | $1,741.00 | $117,643.00 | $38,866.00 | $156,509.00 |
| Bradford Wilkie | Management Srv Dir/Fin Dir/City Treasurer Lompoc, 2012 |
$98,125.42 | $0.00 | $5,057.58 | $103,183.00 | $49,799.00 | $152,982.00 |
| Bradford Wilkie | Management Srv Dir/Fin Dir/City Treasurer Lompoc, 2011 |
$93,029.00 | $0.00 | $14,511.00 | $107,540.00 | $40,857.00 | $148,397.00 |
So I ask when you continue to have rising city employment costs, and a decreasing tax base, low-income job market, and a growing number of vacant businesses, you might want to take a step back & ask how is this sustainable?
If we look at Lompoc’s summary below, it is shocking that the average private worker is paid half of what an average city worker makes. As this trend continues, and pensions, retirement, and benefits continue to rise, you will only experience a great disparity, which usually results in tax hikes for justifying the cost of maintenance, improvements, and real estate purchases for city projects.
Summary of Lompoc Data – 2017 (Source)
| Total population | 43,762 |
|---|---|
| Total number of city employees | 183 |
| Total number of full-time, year-round city employees |
117 |
| Median pay for full-time, year-round city employees |
$63,600 |
| Median pay and benefits for full-time, year-round city employees |
$83,663 |
| Total city employee compensation | $11,258,314 |
| Total city employee compensation cost per resident |
$257 |
| Median earnings for full-time, year-round private workers |
$32,708 |
Notes:
- Full-time, year-round employees defined as those receiving a base salary equal or greater to their “annual salary minimum.” In the event this information is not provided, full-time employees are defined as those receiving at least $25,000 in base pay and receiving employer-paid benefits.
- The values for total population and median earnings for full-time, year-round employed residents are from the most recent American Community Survey results as conducted by the United States Census Bureau.
- Lompoc Employee Payroll 2017
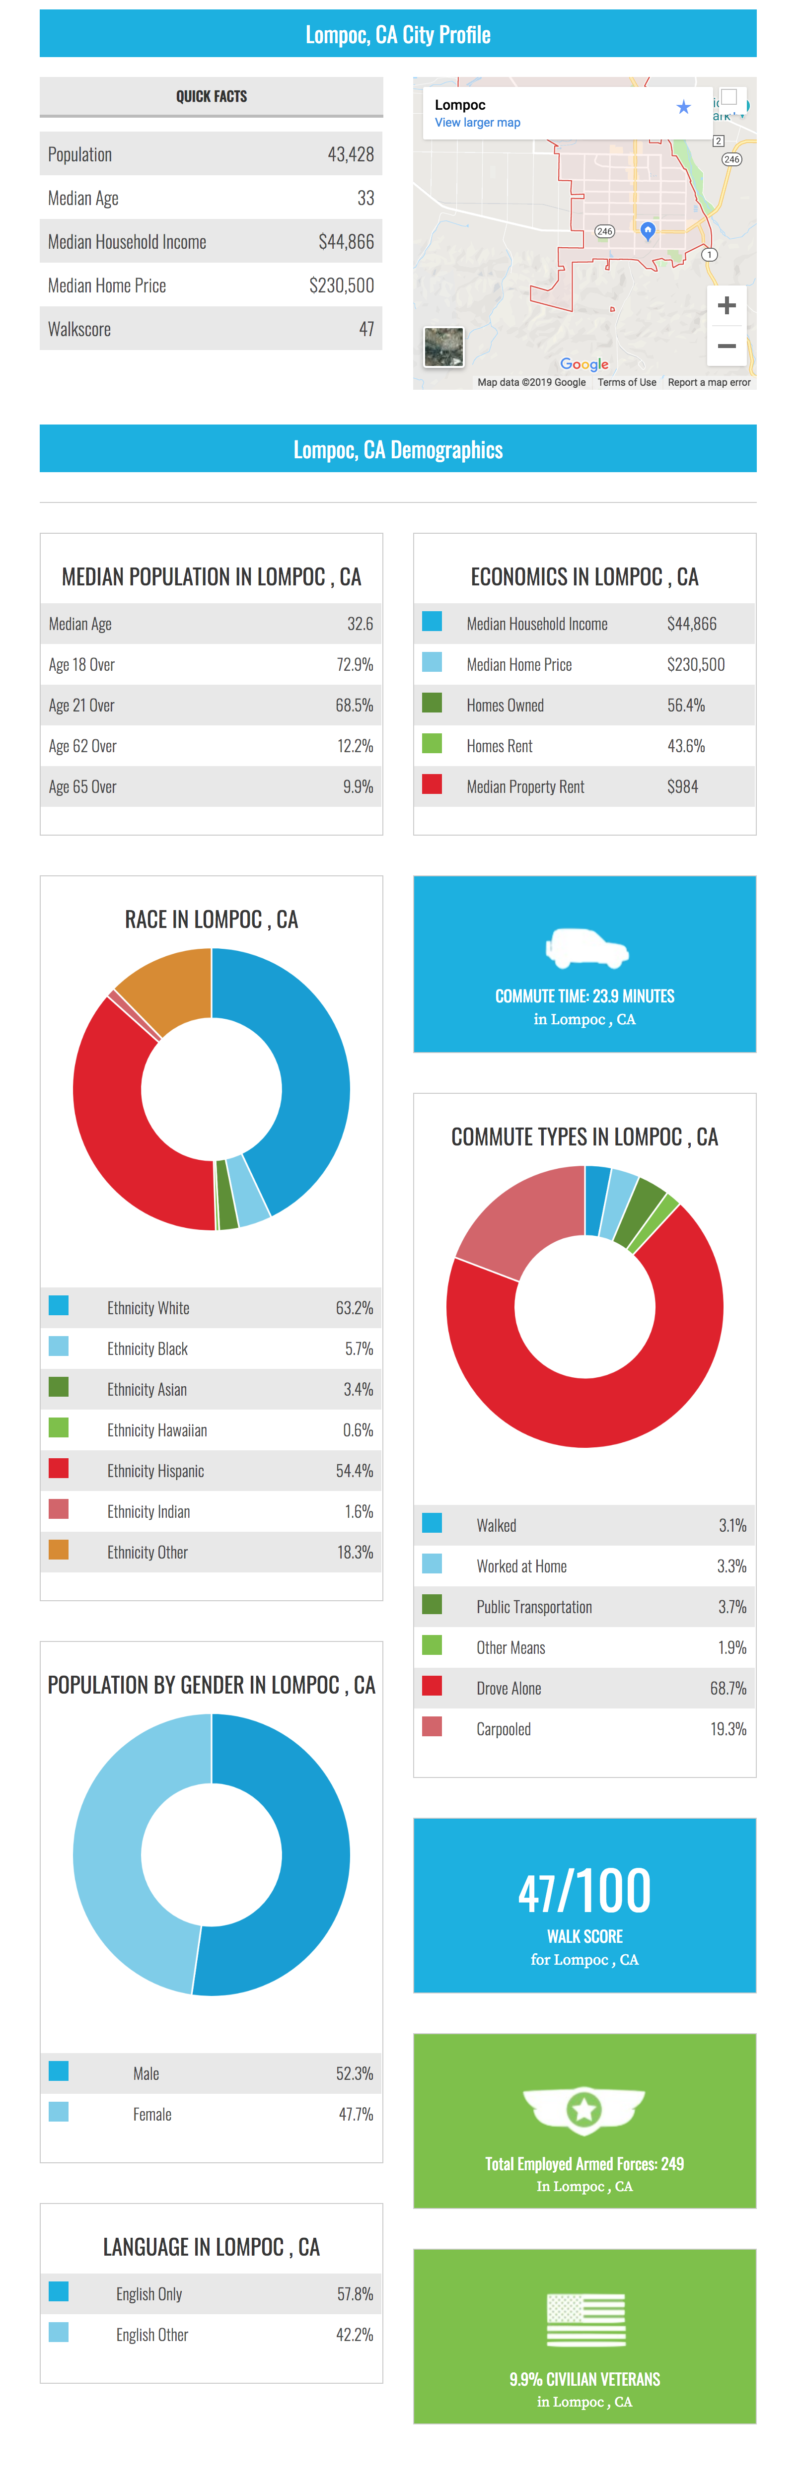
Lompoc Quick Facts Sheet